Shells: Cuts
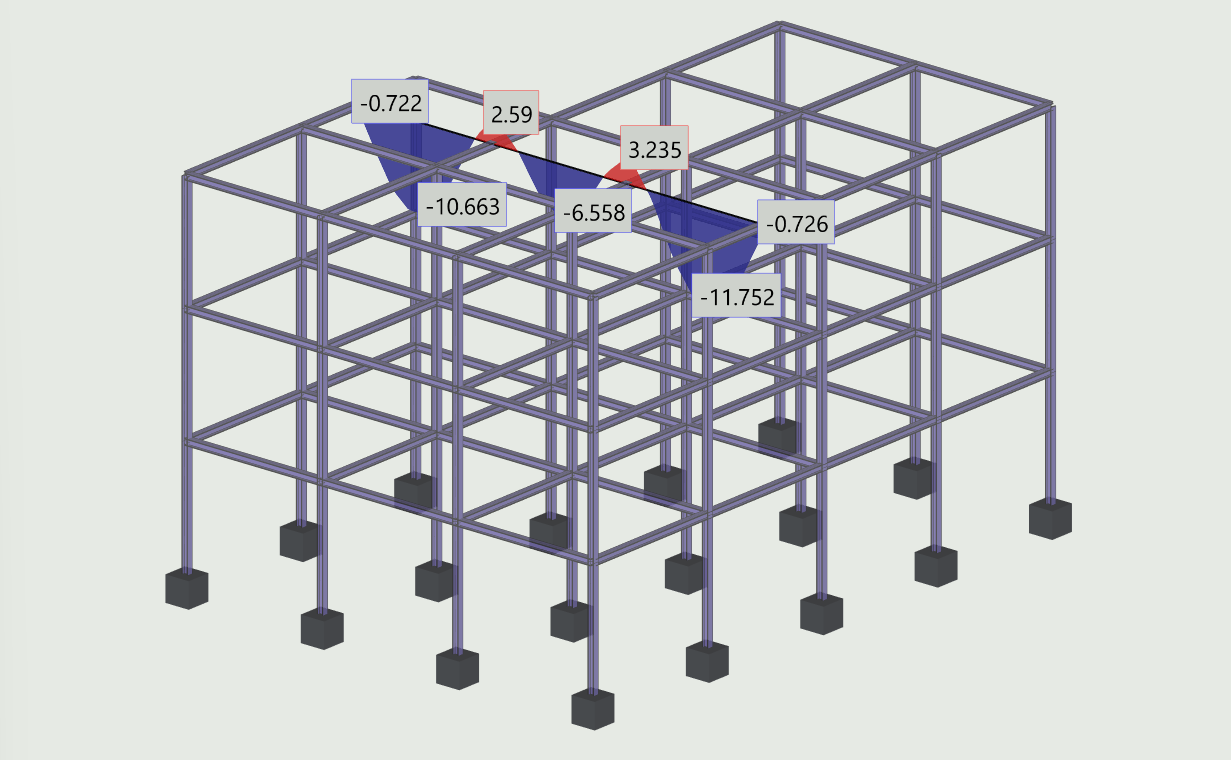
As an alternative to viewing shell results using contour maps, you can also explore them along section lines and display them as diagrams. All shell result types described previously can be viewed in this way.
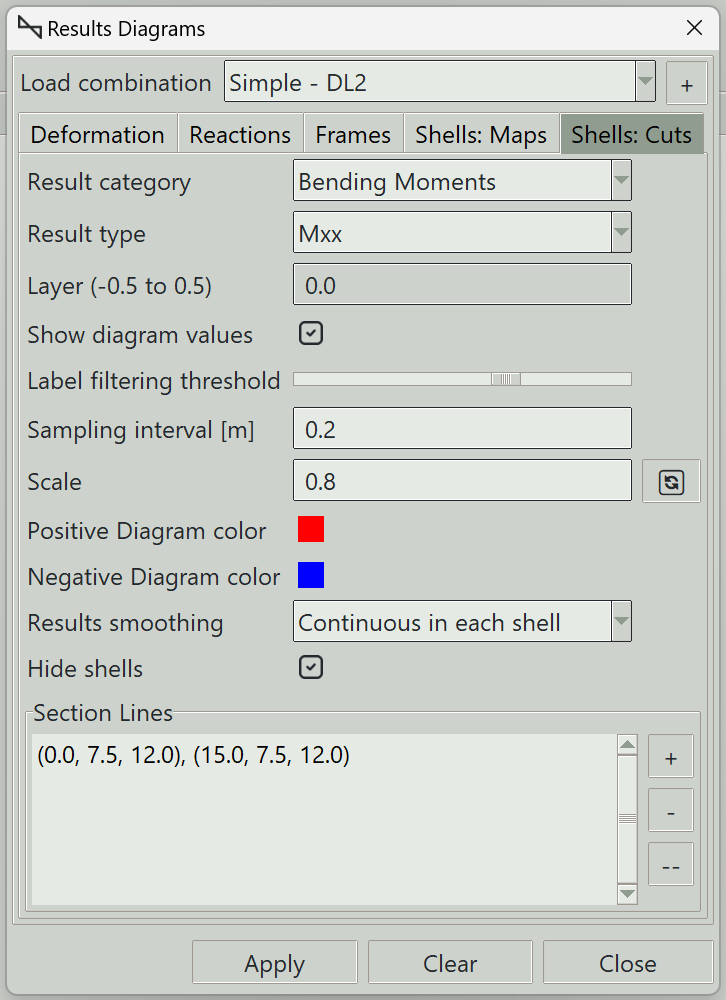
1. Load combination
The name of the load combination to display results for.
2. Result category and type
The various types of shell results available are described in the shell maps section.
3. Layer (-0.5 to 0.5)
The layer at which the stress is required, ranging from -0.5 (bottom surface) to 0.5 (top surface)
4. Show diagram values
Whether to display results values on the maps.
5. Label filtering threshold
A slider that controls the tolerance for selecting which points along the result diagram are labeled. Higher values increase the selection tolerance, resulting in fewer labeled points. Lower values reduce the tolerance and display more labels.
6. Sampling interval
Defines the spacing of sampling points along section lines where results are evaluated. Smaller values produce smoother diagrams.
7. Scale
Controls the amplification factor of the displayed results diagram.
8. Positive diagram color
Sets the color used to display the positive sides of diagrams.
9. Negative diagram color
Sets the color used to display the negative sides of diagrams.
10. Number of contours
The number of divisions to use in the color map.
11. Results smoothing
Due to numerical approximation, results from one finite element may not exactly match those from an adjacent element. Some averaging may therefore be required to produce smoother and more representative results. You can choose from the following smoothing options:
- None: No smoothing is performed. Raw element results are displayed.
- Continuous in each shell: Result values along shared edges are averaged between adjacent finite elements belonging to the same shell.
- Continuous in model: Result values along shared edges are averaged between adjacent finite elements throughout the model, even when they belong to different shells, provided they are connected. Use this option with care. Different shells may have different local axis orientations, meaning the results may not represent the same physical directions and may therefore not be suitable for averaging.
12. Hide mesh
Whether to hide the shells when the results are displayed.
13. Section lines
You can draw section lines along which results are required. The available section lines are listed in this container.
- Click the + button to add a new section line.
- Click the - button to delete the selected section line.
- Click the -- button to remove all section lines.
Results for a section line are only displayed if the line lies on a shell. If the line does not lie on any shell, no results will be shown for that section line.
14. Add Section line
When you click the + button, this window opens so that you can define a section line. A section line is created by specifying two 3D points. You can enter the coordinates manually and click the Accept button, or simply pick the points in the drawing window.
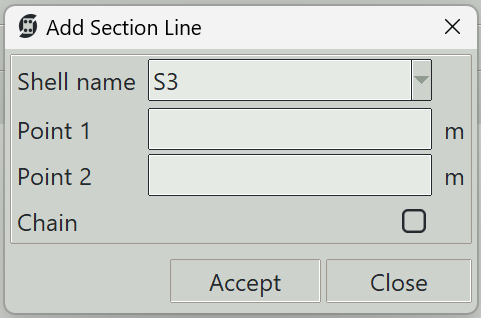
14.1 Shell name
The name of the shell on which the section line is to be created.
14.2 Point 1
The x, y, z coordinates of the first point of the section line.
14.3 Point 2
The x, y, z coordinates of the second point of the section line.
14.4 Chain
If checked, the last picked point will be considered the first coordinate for the next line.
15. Apply button
Displays the selected results type on the available section lines. If some shells are selected, results are displayed only for those shells.
16. Clear button
Clears all result graphics from the model view.
17. Close button
Closes the window and clears all result graphics.